

17. Quality Food Centers
17. Quality Food Centers
A historical review of Quality Food Centers (1988 - 1996) and details on Sam Zell's investment in 1994

I recently had the idea to find a company and study its historical financial reports. This seems like a great exercise to i) better understand a particular sector ii) understand the company’s position and prospects through the period of study and iii) evaluate a transaction with information available at the time (plus the benefit of hindsight).
I had no particular sector or company in mind when starting this exercise. I clicked through a few companies on Washington University’s database and honed in on Quality Food Centers. This pick interests me as I may be able to make comparisons to FedMart (Sol Price) and Costco (Jim Sinegal) - we’ll save the comparisons for a second post.
The format of this post may get messy as I go through. Each section will house random notes from each year’s annual report. At the end, I will draw conclusions and note interesting takeaways from the study.
Feel free to read each year’s notes or skip to the end for the takeaways.
1988
Quality Food Centers (QFC) is the largest supermarket chain in Seattle / King County, Washington, operating 22 stores.
The Company’s describes themselves as competing on providing superior customer service. Other value propositions include i) provide high quality perishables and ii) offer convenient store locations
QFC’s level of customer service is directly linked to the quality of our employees, who we think are the best in the business
Brief financial summary from 1984 - 1988 (**note figures illustrated on a pro forma basis for the 1986 acquisition of QFC**)

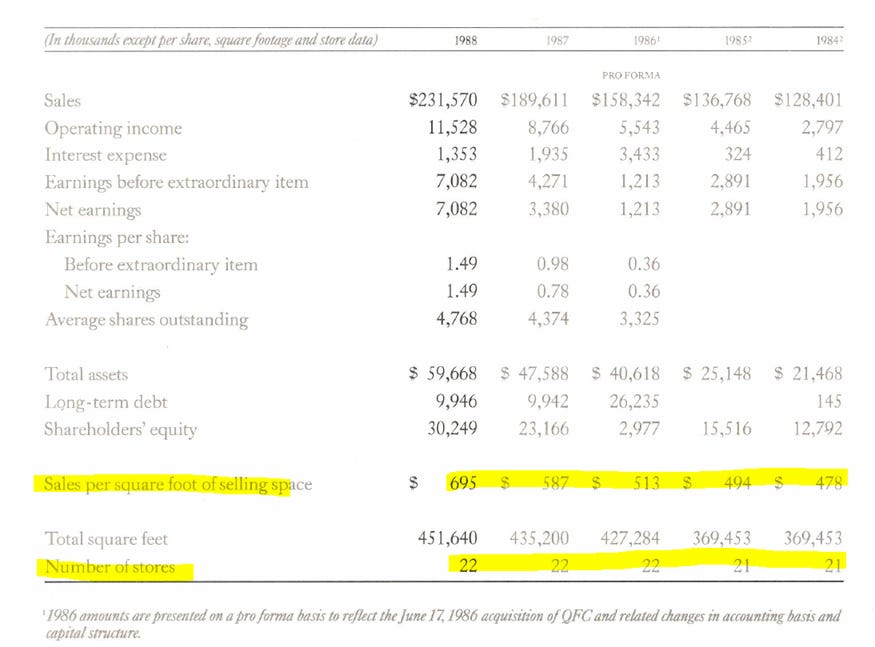
The business has grown remarkably well… on a SSS and total basis.
Interestingly, note the two highlighted rows above. Number of store count has largely remained flat while sales per square foot has increased considerably.
A first thought would be that they are becoming dramatically more efficient at maximizing sales within existing space… which is partially true.
However, look at the total square feet line. They have increased total square footage by ~22% since 1984. Sales have increased by ~80% in the same period. So, yes, they are becoming better at extracting more sales per square foot.
Reading the financial report shows that they have added square footage through store remodels to help further drive sales growth.
Store Remodeling Program / Capital Allocation
Management seems focused on allocating capital to remodeling stores. Recent financial performance indicates this is an efficient use of capital that drives sales and margin expansion.
Store remodeling entails enlarging the stores, broadening product selection and adding new departments. Oftentimes management may double the size of a store in a remodel project.
1988 saw 5 store remodels.
Average cost of ~$1 million per store.
Goals of a remodel:
i) Increase square footage
ii) Expand existing departments (especially produce, frozen foods, wine and floral)
iii) Add a number of new service departments such as delicatessens, seafood counters, salad bars and bakeries. Some stores even have espresso bars and video rentals. Note: service offerings are high margin and increasing service revenue significantly boosts operating margin.
Other notes:
26.5% return on equity; ~20% ROA (company uses little debt)
First priority is customer service
4 stores to open in 1989 and 1990 - ranging from 32,000 to 42,000 square feet
Will raise total square footage by 36% to ~612,000
Management notes that increased selling prices accounted for ~3% of the 1988 sales increase, less than 2% in 1987 and ~1% in 1986… appears most of growth is coming from volume and remodel benefit
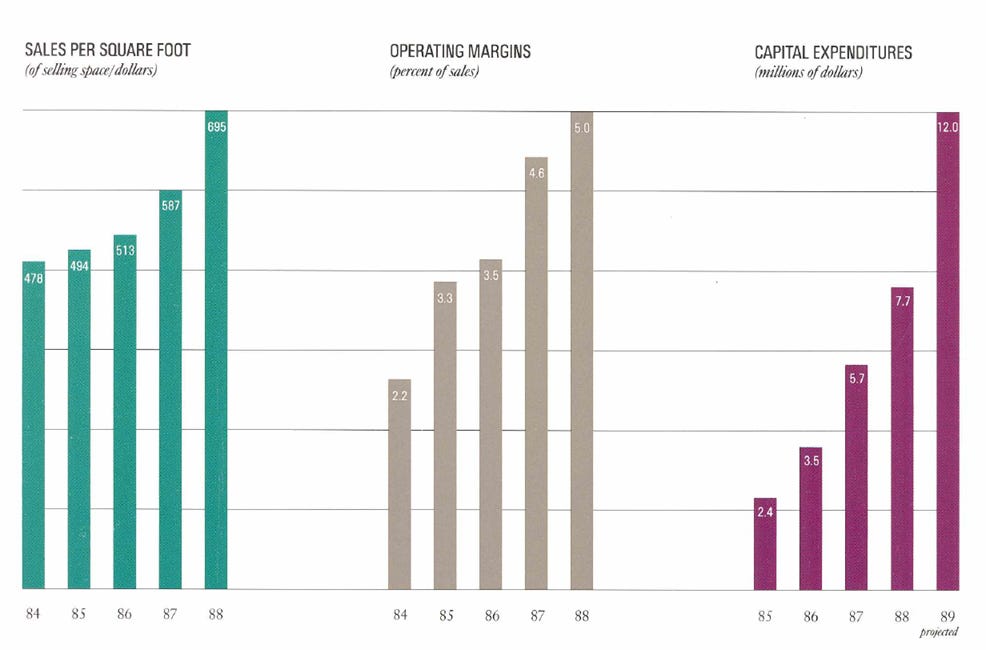
Operating margin expansion below driven by higher margin service departments (delicatessens, seafood and bakeries)
Expect elevated capex in 1989 and beyond (~$12mm / year) as management focused on store remodels and new store additions

1989
Total stores now total 24 after opening 2 stores during the year. Management has line of sight to 27 total stores by 1991.

New store opening details:
Crown Hill - 33,000 square feet
Pine Lake - 36,000 square feet
Both stores have full service delicatessen, bakery, seafood and floral departments, fresh juice and coffee / espresso bars, large frozen food sections, extensive wine selections, expanded produce departments and even in-store banks.
Remodeled the Mercer Island store - doubled square footage and added all of the service departments and an in-store bank.
The square footage and service offerings show consistency re management’s plan to expand square footage per store and offer high margin service offerings.
The two stores to open in 1991 will add 37,000 and 32,000 square feet each.
Management reiterates that they will not grow for growth’s sake, only for long-term profitability.
We have seen this discipline in the last two reports. Not only has the business seen exceptional growth, but margins continue to expand to record levels as increased service offerings reducing direct cost of sales and a tight control of costs.
Dan Kourkoumelis, a 22-year QFC veteran, took over the role of President.
Price increases accounted for 4% of sales growth (total sales growth of 38%… 22% adjusting for the labor dispute impact). **A labor dispute, which did not include QFC, resulted in competing supermarkets to close for 12 weeks. Management estimates growth would have been closer to 22% YoY after adjusting for the positive impact of the dispute on QFC figures.**
The Company repaid all outstanding long-term debt ($10 million). Previously repaid $16.7mm in April 1987 (in connection with the IPO) and $10 million in the current year with cash generated from operating activities. The senior subordinated notes yielded 13.375%. Seems like a smart use of excess cash.
Operating margins improved from 5% of sales in 1988 to a record 6.5% of sales in 1989.
Not only is the business growing, but management is ensuring costs do not balloon to keep pace with outsized growth. Seems to be a clear sign of exceptional management from a review of the ‘88 and ‘89 reports.
Capital allocation in the past few years has focused on i) remodeling existing stores ii) invest in new stores iii) repay debt to clean up the balance sheet.
Other Notes
ROE of 35%


1990
Store count now totals 27 locations.


Positive financial trends have continued through 1990. The Company added over 100k of square feet through one store opening, 2 store acquisitions and ongoing expansion and remodeling of existing stores.
Summary:
It’s interesting to note that sales per square foot of selling space decreased in 1990 compared to the prior year. This is likely a result of the increased 1989 sales due to the labor dispute which may have elevated the figure in ‘89. The 1990 figure is still up materially compared to 1988
Net earnings increased 24% to ~$16mm and the margin increased to 4.6% from 4% last year.
ROE of 31%; ROA of ~20%
2 year compounded growth in revenues and earnings of 22.5% and 50%, respectively. 5-year growth rates of 20.5% and 40.7%, respectively
Invested $43mm in store renovation, construction and acquisition over last 5 years (~$8.6mm / year)
Clean B/S – no long term debt and ~$26mm of cash
The Company’s cash positioned increased $12.7mm to $26 million at year-end, or 28% of total assets
Common stock – increased authorized shares from 10 million to 30 million, largely to support ESOP program
Not sure how this will effect dilution of existing owners… worthy of noting
Margin improvements driven by i) more sales from higher margin service departments ii) more effective merchandising and buying (management has invested heavily in technology and centralizing merchandizing) and iii) reduced shrinkage resulting from improved controls
Management continues to successfully execute on the above initiatives to drive sales growth and margin improvement
On March 8, 1991, the Company announced plans at acquire assets from F.D. Processing, Inc. for ~$11mm. The assets largely include a regional dairy processing facility operating in the Pacific Northwest. In November 1990, a court-appointed receiver took control of the target company at the petition of its primary secured lender… it appears the business was in bankruptcy. This may be another sign of great management and its ability to find value
Also interesting to note that they appear to be investing across the supply chain by looking to own a dairy processor
Store openings:
Totem Lake - 38,000 square feet
Coal Creek - 33,000 square feet
Westwood Village - 36,000 square feet
Management highlighted in this report that they are becoming more interested in owning future store locations. Historical strategy has been to lease already built or built-to-suit stores on a long-term basis.
Currently own real estate at 3 locations with an option to purchase a 4th
Real estate is not currently a material part of the Company’s operations

The 274k of additional store space represents more than 40% of the Company’s current store square footage. Management expects to add another 130 – 140k square feet in 1991
Expect capex to exceed $20mm to support store expansion and remodeling initiatives

1991
Total stores increased to 30 from 27 in 1990 (increased square footage by 20%). Growth came from 3 new store openings.

Financial performance continued to perform well. We will discuss the sales per square foot below, as management included a few sentences on this figure in this year’s report.
Summary:
Jack Croco, the Founder and former Co-Chairman, passed away in March 1991
Dan K., who we noted was elevated to President in 1989, joined the Board of Directors in 1991
Total sales rose to a record $395.2mm in 1991, a 13.7% increase (without looking at the sales per square foot metric above, we can infer that the figure is lower than the prior year… this is because sales grew by ~14% while square footage grew by 20%)
Comparable store sales were up 3.3%
7.6% operating margins, a full 1% increase over the prior year
As a result of the sales gains and increased margins, net earnings rose 30% to $20.6mm
5.2% of sales, up from 4.6% last year
ROE of 29%; ROA 19%
Prior year acquisition
Acquired the real estate of the dairy plant formerly operated
Management confirmed that the business went into bankruptcy
QFC sold all of the equipment and rolling stock in February 1992. Currently evaluating how to best monetize and utilize the real estate
Launched QFC Express service last year – provides telephone shopping and home delivery. Customers can order anything and have it delivered the same or next day
Thousands of deliveries made in the last 12 months
Continued improvement in GM and operating margin
Liquidity – cash from operations exceeded capital expenditures by $7.9mm, but total cash and cash equivalents decreased by $3.6mm to $22.8mm due to the acquisition of assets of a former dairy plant for $10.5mm
Income statement figures as a percentage of sales

We have focused on the sales per square foot figures in past years. Management specifically included language addressing this figure in the 1991 report:
New stores have become a more significant part of the Company’s sales growth. Consequently, sales per square foot declined slightly since a greater portion of the Company’s sales are from newer, larger and less mature stores
Store Openings
Expect to open 5 stores in 1992 to add over 160,000 square feet and bring the total store count to 35
Already acquired 2 of the 5 stores slated for 1992
Reiterated strong interest in owning new real estate due to strong cash position and opportunity to better control occupancy costs
Currently owns 3 stores and will own the new store to be built in 1992
20 store remodels in the last 7 years (37 year company history… so this is a point where they’re fully refurbishing their asset base and seeing much strong earnings power as a result)

From 1986 – 1991:
18 stores remodeled
7 new store openings
2 store acquisitions
Over 50% of the current square footage has been added during this period, representing a major period of growth for the business
Expect to add over 200,000 of square feet in 1992 through new construction, acquisition, and remodels
Expect capex to exceed $25mm
1992
Total stores of 36; will be 38 by end of 1993. Management has grown beyond King County and remains confident in the large market opportunity. Shoppers spend $4bn in the region (of which WFC has a 12% market share using the 1992 sales figure).

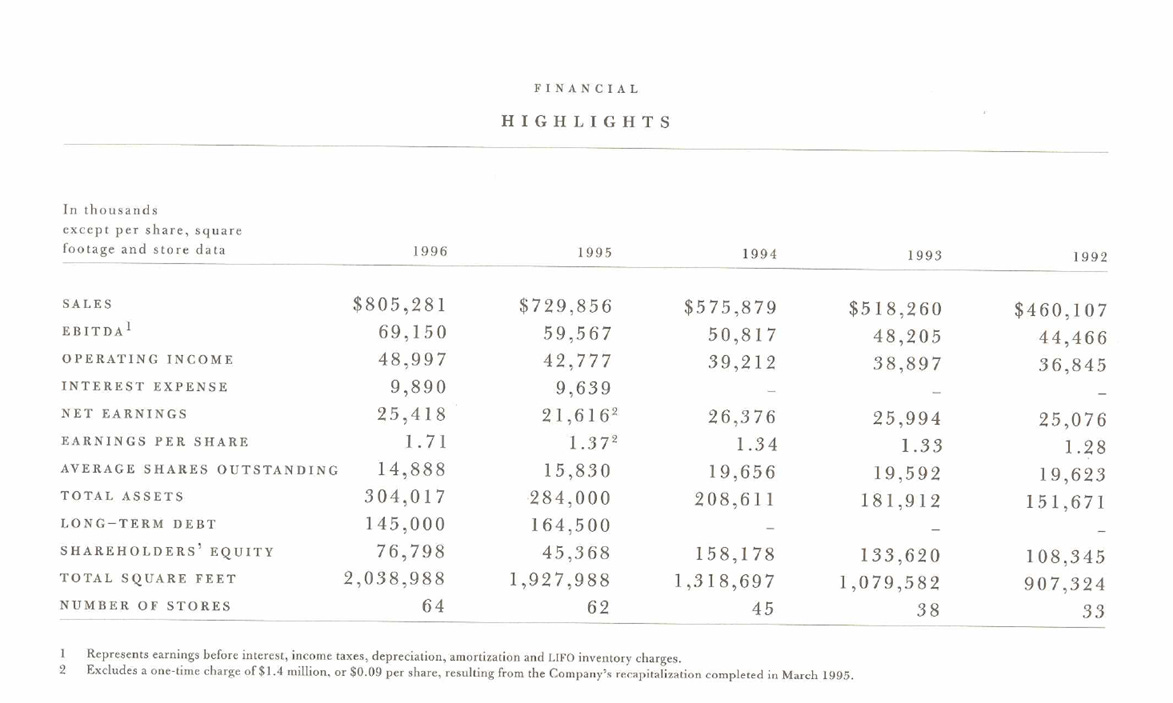
Notice growth in shareholder’s equity over time! We have not looked at the stock price yet… but that’s impressive value creation.
New Stores
Added 3 stores during the year – opened first stores outside of King County – and remodeled 6 locations
Total square footage increased by 18%
Will soon own 5 stores (reflects increased focus in owning RE)
Added a second executive to the retail real estate team
Store acquisitions have increased – 6 of the 15 newest stores were acquisitions
Expect to increase square footage by 19% in the next year, or over 170,000 of additional square feet through acquisition, remodels, and new construction
Continue to increase amount of square footage added per year, reflection of investment in new locations, remodels and acquisitions.
Expect capex to exceed $27mm
Store Information:

Remodeling Program
Sales increases from store remodeling have ranged from 25% to 100% in the first year of operation
85% of stores are new or remodeled in the last 5 years
Summary:
Sales increased 16.4% to $460mm – nearly double the sales figure only 4 years ago
Food prices declined by almost a full percent but comparable store sales rose 2.9% in 1992
More than 80% of stores feature full-service bakeries (reflects invest in higher margin businesses / departments)
Operating margins increased to 8.0% from 7.6% in 1991
Net earnings rose 21% to $25.1mm, a record 5.4% of sales in 1992
$37mm of cash and no long-term debt
While cash represents 25% of assets, ROA still came in at 19%, reflecting high returns on assets
ROE of 26.5%
Expanded home delivery service, QFC Express, to cover more of the Puget Sound area
Continued focus on technology investments – became first supermarket chain in the area to introduce an electronic payment system that enables customers to pay for purchases with both debit and credit cards
Cash provided by operations was $36.6mm, which exceeded capex by $10.1mm
Location Summary:

1993
1993 is arguably the most underperforming year in the Company’s recent history that I have reviewed.
Total stores came in at 39, in-line with management’s 1992 guidance.

Summary
Increased square footage by 19%
More challenging operating environment in the Seattle / Puget Sound region characterized by slower economic growth and continued food price deflation of ~1%
Total sales increased by 13% with comparable store sales increasing by 2.9%
7.5% operating margins, a decrease from the record 8.0% in the prior year
Sales reflect continued price deflation while certain operating expenses, such as labor and utilities, reflect rate increases
$40mm of capex
ROE 21.5%; ROA 16% - lower than historicals
Established a regular quarterly cash dividend and authorized a 1 million share stock repurchase program
Before 1993, store remodeling and new construction drove capital allocation decisions. Cleaning the balance sheet was a secondary focus in the late 80s. This year, management has expanded its focus by providing a cash dividend and initiating a repurchase program.
Meant to offset dilutive effect of the stock options program
Coupled with a challenging macro environment, the Company added the most stores (5) it has opened in a single year, and saw reduced profitability through its operating margin.
So, this is a good example of growth while sacrificing profitability. It’s unclear how much of the margin compression is attributed to the softer economy and how much to increased costs
COGS increases 10 bps as a % of sales compared to the prior year and SG&A increased by 40 bps compared to the prior year. That explains the 50 bps decrease in operating margin YoY. The SG&A increase is presumably due to higher costs of new construction before stores fully ramp
New Stores and Remodeling Program
Added 18 stores since the accelerated expansion program began in 1986
1993 was the most active year, adding 172,000 square feet
5 stores added in 1993 – 2 acquisitions and 3 new construction
Continue to acquire more of the underlying real estate as the Company adds stores
Now own 5 store locations
Remodeled 24 stores since 1986, 4 of which have been remodeled a second time
Management alluded to cannibalization when opening certain stores in existing markets


Related Party Transactions
The 1993 report has an interesting section on page 25. The Chairman and CEO is a principal shareholder whom the Company pays a 0.2% management fee (% of sales). This fee has been ~$1.037mm, ~$920k and ~$790k in 1993, 1992, and 1991, respectively
In August 1993, two partnerships which include the Company’s Chairman, CEO and principal shareholder acquired a 24 acre shopping center where one of the Company’s stores is located and which is adjacent to the 8.8 acre parcel of land acquired in 1991 (now included in real estate held for investment).
The Company negotiated with the partnerships (inherently, with the CEO) for certain property rights and lease modifications, which provide the Company the right to be the exclusive grocery store in the center, the right to relocate its store and a lease term extension of 15 years. The Company paid $4.96mm for the rights (included in Leasehold Interest and amortized over the life of the lease)
This is interesting commentary… without going too deep, sure, the rights have some value. To the extent the rights are worth ~$5mm, I don’t know.
Worst case, this is a value transfer from QFC shareholders to the Chairman and CEO
Best case, this is a bargain deal to operate exclusively in the shopping center. My skeptical intuition leans more towards the value transfer…
1994
57 total stores.

1994 was another challenging year
Summary
Increased square footage by 22%
Announced the largest acquisition in the Company’s 40-year history, making QFC the second largest supermarket chain in the Seattle / Puget Sound region
Interesting capital allocation decision
Deviates from the company’s recent history of acquiring individual store locations (or outfits with 2-3 stores)
Sales increased by 11% YoY, partially offset by food price deflation of 1.4%
Comparable store sales slightly declined due to i) food price deflation ii) increased competition in competing stores and iii) cannibalization of new stores with existing store sales
Operating margins decline from 7.5% to 6.8%
i) larger and newer store base ii) higher labor rates in a deflationary environment and iii) lower profitability levels in the 6 stores acquired in the past year
ROE 18.1%; ROA 13.6%
Added 22% square footage in 1994
Began the year with 45 stores and announced or completed the acquisition of 16 additional locations, bringing the count to 61 stores, increasing square footage by 48% in 1995
Square footage will total ~2mm square feet, almost 5x the 1986 size!
Initiated a recapitalization, including a self-tender for up to 7 million shares of common stock at $25 / share
New $220mm credit facility
The recap transaction brings in a major growth-oriented shareholder (Zell / Chilmark Fund L.P.) and two new members to the Board of Directors (Sam Zell and Joel Friedland)
The Olson’s Food Stores Transaction
Paid $19mm in cash, issued 752,941 shares of common stock and assumed $24mm of Olson’s long-term debt
In connection with the tender offer, the Company agreed to sell 1,000,000 newly issued shares of its common stock to Zell / Chilmark at $25.0.
Zell / Chilmark will also acquire 2,975,000 shares at $25.0 directly from the Company’s chairman and CEO in a separate transaction
The Company will borrow up to $174mm under the new $220mm senior credit facility to finance the $24mm of long-term debt assumed in the Olson’s merger and to repurchase its shares pursuant to the self-tender offer
The credit facility consist of a $140mm term loan and $80mm of revolving credit loans… IF 7,000,000 shares are purchased in the tender offer
The impact on the Company’s financial statements are as follows:
i) lower cash balances
ii) reduction in shareholder’s equity
iii) increase in long-term debt
iv) reduction in interest income and increase in interest expense
Store Expansion

Very interesting development having Sam Zell’s fund come in to the cap table in 1994. I had no idea that Zell was around this one… but makes plenty of sense after a review of 1986 - 1994 performance…
1995
62 total stores at year-end.

The Company started showing EBITDA in the financial summary
Since 1995, the Company has grown from 21 stores and 500 employees to 62 stores and 4,200 employees
Sales have increased from $136mm to $730mm and operating cash flow from $5.9mm to $58.9mm
Store expansion
i) acquired 27 stores from 9 different operators
ii) built 14 new stores
iii) remodeled 38 existing locations
1995 marks a second chapter in the recent growth phase: expanding beyond the Seattle / Puget Sound area
Summary
Increased total square footage by 46%
27% increase in sales that reflects 17 new stores and 7 remodeled stores
Offset by a 1.7% decline in comparable store sales
5.9% operating margins compared to 6.8% in the prior year
Zell / Chilmark Fund L.P. invested ~$100mm for 27% of the outstanding stock and 2 board seats
Acquisitions became the primary growth driver last year. Previous years relied upon existing store remodels

Margins are moving in the opposite direction that we would like.. what happened to management’s tight control over costs? Are they chasing growth too quickly? The past few years might be indicative of a change in focus + new investor money who will want growth

Quarterly cash dividends have been discontinued because the credit facility restricts payments of dividends prior to 1997
The credit facility has many restrictive covenants which restrict the ability of the Company to incur additional indebtedness or incur liens on its assets, prohibit the company from making certain restricted payments (including dividends) and restricts the Company from making share repurchases before January 1, 1997, as well as meeting certain financial ratios
Libor + 125 bps, or 7.0% at December 30, 1995


1996
146 stores, driven by Hughes and KUI acquisition which more than doubled the store count
Square footage has grown at a compound annual rate of 21% from 1992 through 1996 with over 5 million square feet at the end of 1996
Summary
EBITDA increased 16.1% to a record $69.1mm, representing 8.6% of sales
Capital Allocation
Reduced long-term debt by $19.5mm to $145mm, even after allocating $33mm to capex
Hughes Family Markets acquisition added 57 stores in the Los Angeles area
PF revenue of>$2 billion
Hughes will be organized internally as a separate operating division
Sheli Rosenberg, President and CEO of Equity Group Investments (Sam Zell’s investment company), joined the Board
Leasing space to in-store retail partners like Starbucks, Cinnabon, Noah’s bagels, and bank branches adds to the quality and excitement of the QFC shopping experience
Stores
Acquired 31 stores from 12 operators over the last 6 years
The Kieth acquisition contributed 25 stores
Takeaways From Reading the Annual Reports
Exceptional management team
Always delivered on store count projections
Profitable growth
Tight control over costs and focus on margin improvement
Great capital allocation
Strong focus on customers and developing high quality employees
Frequently invest in and discuss the training program
Sales per square foot
This was an interesting metric to track in the early years of store remodeling / to see efficient changes
However, as the Company pivoted more towards acquisitions as the growth driver, the metric becomes more misleading as the majority of square feet added is from new and acquired stores open for a partial year, and whose sales per square foot are significantly lower than newly remodeled or older, more mature stores
Food price deflation also hurts the figure, especially in recent years where deflation is more pronounced
Pivotal Growth Period
The late 80s and early 90s were a pivotal growth time for the Company. Management’s capital allocation decisions focused on refreshing the asset base (through remodels, expanding service offerings, acquisitions, and new development) to drive sales growth and increase margins
Nearly every store was remodeled with certain locations seeing 2 remodels in this period
1993 had an interesting affiliate party transaction and would point you to this section for commentary
Over time, the acquisition strategy evolved from acquiring individual store locations (or operations with 2-3 stores) to transformational M&A that add dozens of locations and expands the Company geographically
Sam Zell invested in the business in 1994… please see that section for commentary
Since this post has already become far too long, we’ll save other key takeaways and comparisons for part 2.
Thank you for reading!
++
Until next time.
John Galt